Next: Results Up: Introduction Previous: Optimization passes Contents
Variable tracking is not an optimization pass. It computes information that helps the debug output to be better. It tracks where the variables are stored at each position in instruction stream. It is run as one of the last passes in GCC so that no pass could make this information out of date. The debug info is then generated according to this information.
Intel wrote the pass before us and it worked. But they used the code for writing of dwarf so that it could not be contributed to GCC. Cygnus tried to write similar thing with Live-Range Splitting (splitting a variable into several ones so that the variables that are not used in a loop can be moved to stack) and Stabs. Their solution was done by notes generated before Reload and nonstandard extensions and never came to GCC mainline.
People working on GDB like our solution and they are working on the support for it. But it is not done yet so the only way how to use Variable Tracking is use Intel compiler for i960 and run GDB for i960 modified by Intel in a simulator.
After our patch will be contributed to mainline, it will be possible to add the Live-Range Splitting and Webizer, the Register Renaming will be allowed to run with -O29.1 instead of -O39.1etc. These optimizations will make the code generated by GCC even faster.
First we have to know what is stored in a register (in RTL representation). We have added one more field to the RTL representation. This field contains a pointer to structure describing (a part of) a variable stored in register. We use a hash table for these structures. Information about content of a register is updated when using sub-registers, allocating registers or when doing Live-Range Splitting. There is also similar description of variable stored in memory.
The Variable Tracking pass does data-flow analysis. Computing data-flow on RTL
itself would be complicated, so it first scans each basic block and remembers
each use of register/memory in the basic block. Each such a record contains the
register/memory, the instruction that it is in and the purpose
(LT_SET_DEST9.2,
LT_PARAM9.3, LT_CLOBBERED9.4) or the register/memory in the instruction.
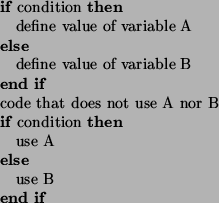
Now we perform the data-flow analysis to propagate the variable locations. We use Hybrid Search Algorithm[8] that is faster than the traditional iterative or worklist algorithms (actually hybrid search algorithm is a combination of iterative and worklist algorithm). First, we initialize the IN and OUT sets for each basic block. The sets are actually arrays of link-lists, each link-list contains the information about (a part of) a variable that is stored in corresponding register. The memory references will be remembered in a hash table. We use link-list for registers because there can be more than one variable assigned to a register (see an example of code where register allocator can assign two variables to one register) but the number will be quite low so the link-list is probably the fastest solution.

Then we clear the "visited" bitmap and set the "pending" bitmap and put all blocks to "worklist" (Fibonacci heap). The blocks in worklist are ordered in reverse completion order of Depth-First Search (DFS) which should speed up the data-flow analysis. We take the first block from the worklist and start search from it. Given a basic block, the IN set of the block is computed as a union of predecessors' OUT sets. Then we clear the pending bit and set the visited bit, and compute the OUT set from the IN set and the recorded purposes of each register/memory in the basic block. If the OUT set has changed we set the successors' pending bits. The search continues in the unvisited successors.
We are passing the locations of variables by NOTE_INSN_VAR_LOCATION notes
to the debug info writer. Each note describes the location of one variable at
the point in instruction stream where the note is. The note contains a list of
pairs (offset, location) because variable can have several parts and each part
has its own location (for example 64-bit integer variable on 32-bit machine has
usually 2 parts). There is no need to emit a note for each variable before each
instruction, we only emit these notes where the location of variable changes.
After the data-flow finishes, we know where the variables are in the beginning and the end of each basic block. We emit two groups of notes for each basic block:
LT_SET_DEST or LT_CLOBBERED the note will be emitted
after the instruction that the reg/mem is in (because the instruction
sets/destroys the value). If the purpose of the reg/mem is LT_PARAM the
note will be emitted before the instruction because a variable is
already in the location before this instruction.
Dwarf2 is one of the first formats of debug info that supports the location
lists of variables. The section of dwarf2 describing variables can contain
location list. Basically it is the list of positions in code and for each
position in code there is a list of changes of variables' positions. Daniel
Berlin <dan@dberlin.org> was so kind and wrote the code for writing this debug
information from NOTE_INSN_VAR_LOCATION notes for us.